

Client Connectivity with PostgreSQL
Resolving database problems can begin with chasing down clients


There are times when you need to chase down database client connections in PostgreSQL. Examples of the issues that arise are:
Having too many idle connections, which can pointlessly throttle database performance due to the backend process resources allocated to each.
Having too many connections in total relative to the semaphore array configuration of the database, resulting in new connections being denied.
Holding transaction-scoped locks for too long or gaining them in a problematic order, which can create errors or deadlocks in other operations that need some of those same locks for work to proceed.
Holding transactions open too long regardless of any locking issues, which can thwart maintenance operations like vacuums and backups.
Burning through transaction ids at an unusual rate, which might trigger id wrap-around too fast for vacuum operations to keep up and thus cause the database to go into recovery mode.
Connection activity may be unexpected or suspicious, in which case you may have a security incident to investigate.
Prev: PostgreSQL 17 on Vagrant and VirtualBox
The TCP/IP Story
When we set up server processes we often find ourselves having to configure one or more ports for access. We become very aware of server-side addressing via IP or DNS name plus a port. What is easy to forget is that the client end of the connection also has addressing information associated with it.
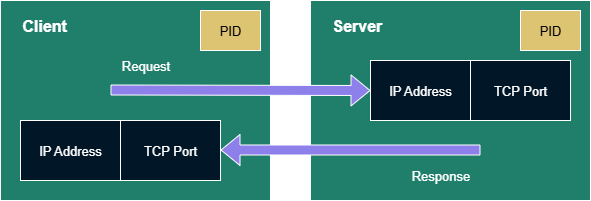
With each client-server interaction:
There is a client process, and that process has a process id (PID).
There is a server process, which also has a PID.
Requests originate from the client and are sent as TCP/IP packets to the server.
Responses originate from the server and are sent as TCP/IP packets to the client.
The client finds the server via an IP address and TCP port. That port is the one we tend to be aware of as software engineers. When we configure a client we tell it the IP address — or indirectly, via a DNS name — and the port.
The server also finds the client via an IP address and TCP port. We don’t configure the information into the server, so how does it know about the client?
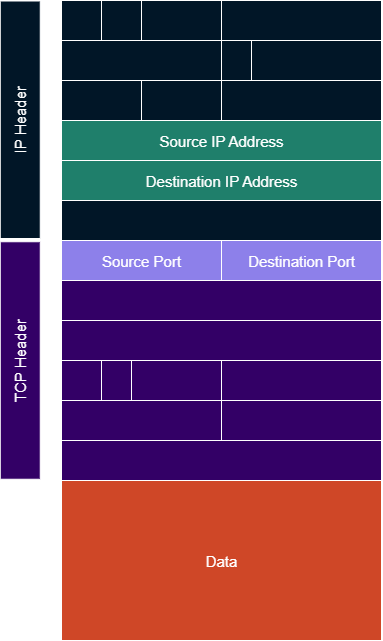
The answer is in the IP and TCP headers for each packet.
IP headers contain several fields, which include both source and destination IP addresses.
TCP headers also contain several fields, including both source and destination TCP ports.
The way a server knows where the client is located is by extracting those fields when a request is received, and using them when it generates a response.
While the server port resulted from static configuration, client ports are often determined on-the-fly and sometimes referred to as “ephemeral” ports.
There is information missing from these packets: the PIDs. Nothing in the network traffic knows about processes. That association is handled by operating system support which the application processes make use of.
The client process will use a socket and bind it to the client IP address and ephemeral TCP port.
The server process will use a socket and bind it to the server IP address and statically-configured TCP port.
Ports and PostgreSQL
The picture changes when you introduce a PostgreSQL service into the equation. Since TCP/IP packets don’t know anything about processes, there is no reason to restrict ourselves to a single server process for the implementation.
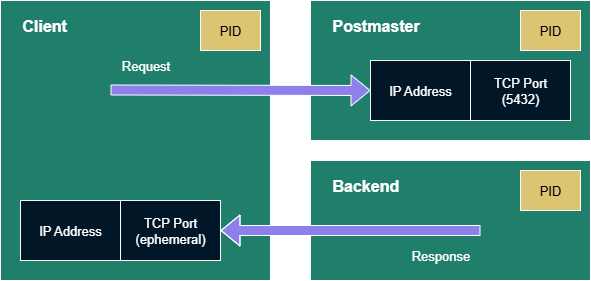
PostgreSQL has several processes, but for this discussion we are concerned with two:
The Postmaster is the process that listens to that statically-configured port known for establishing connections. The default is 5432.
For each client connection the Postmaster will identify or launch a Backend process to do the work the client is requesting. The Backend is the process that will use the client IP address and ephemeral port for responding with the results.
There are more complicated processing scenarios in PostgreSQL but we’ll ignore them for today. What is shown here accounts for what is typical.
We’re simplifying the picture a bit here as clients and backends can continue this back-and-forth between requests and responses. The Backend is delegated to deal with both once the Postmaster finishes accepting the incoming client connection. The Postmaster will go back to listening for fresh connection attempts.
Note that 5432 is not an entirely arbitrary choice of number. There is an official IANA registration for the service name and port. While you can configure PostgreSQL to use other ports, by sticking with 5432 you will find some network-aware Linux tools will automatically know that “5432” and “postgresql” are interchangeable.
Gathering Client Connection Data
All of this connection and request/response activity isn’t just hidden away in the memory state of the various processes. We can examine it. Some of that examination can happen within PostgreSQL itself, while some needs to be done with O/S tools.
We’ll explore this via the Vagrant/VirtualBox VM from the previous article. Refer to that if you haven’t already spun up your own PostgreSQL sandbox.
# cd to the project directory with the Vagrantfile before proceeding
vagrant up --provision
vagrant ssh
Now we can use a psql session to do some looking around. We’ll use the vagrant database and username as we previously created that as a superuser. As a memory-jogger we just used the trivial password “vagrant” for that sandbox. We’ll get into the details of database authentication and security in future articles.
psql --host=localhost --dbname=vagrant --username=vagrantYou don’t have to specify the dbname as it is the one associated with the username, but it’s worth seeing an example of how to when you need to.
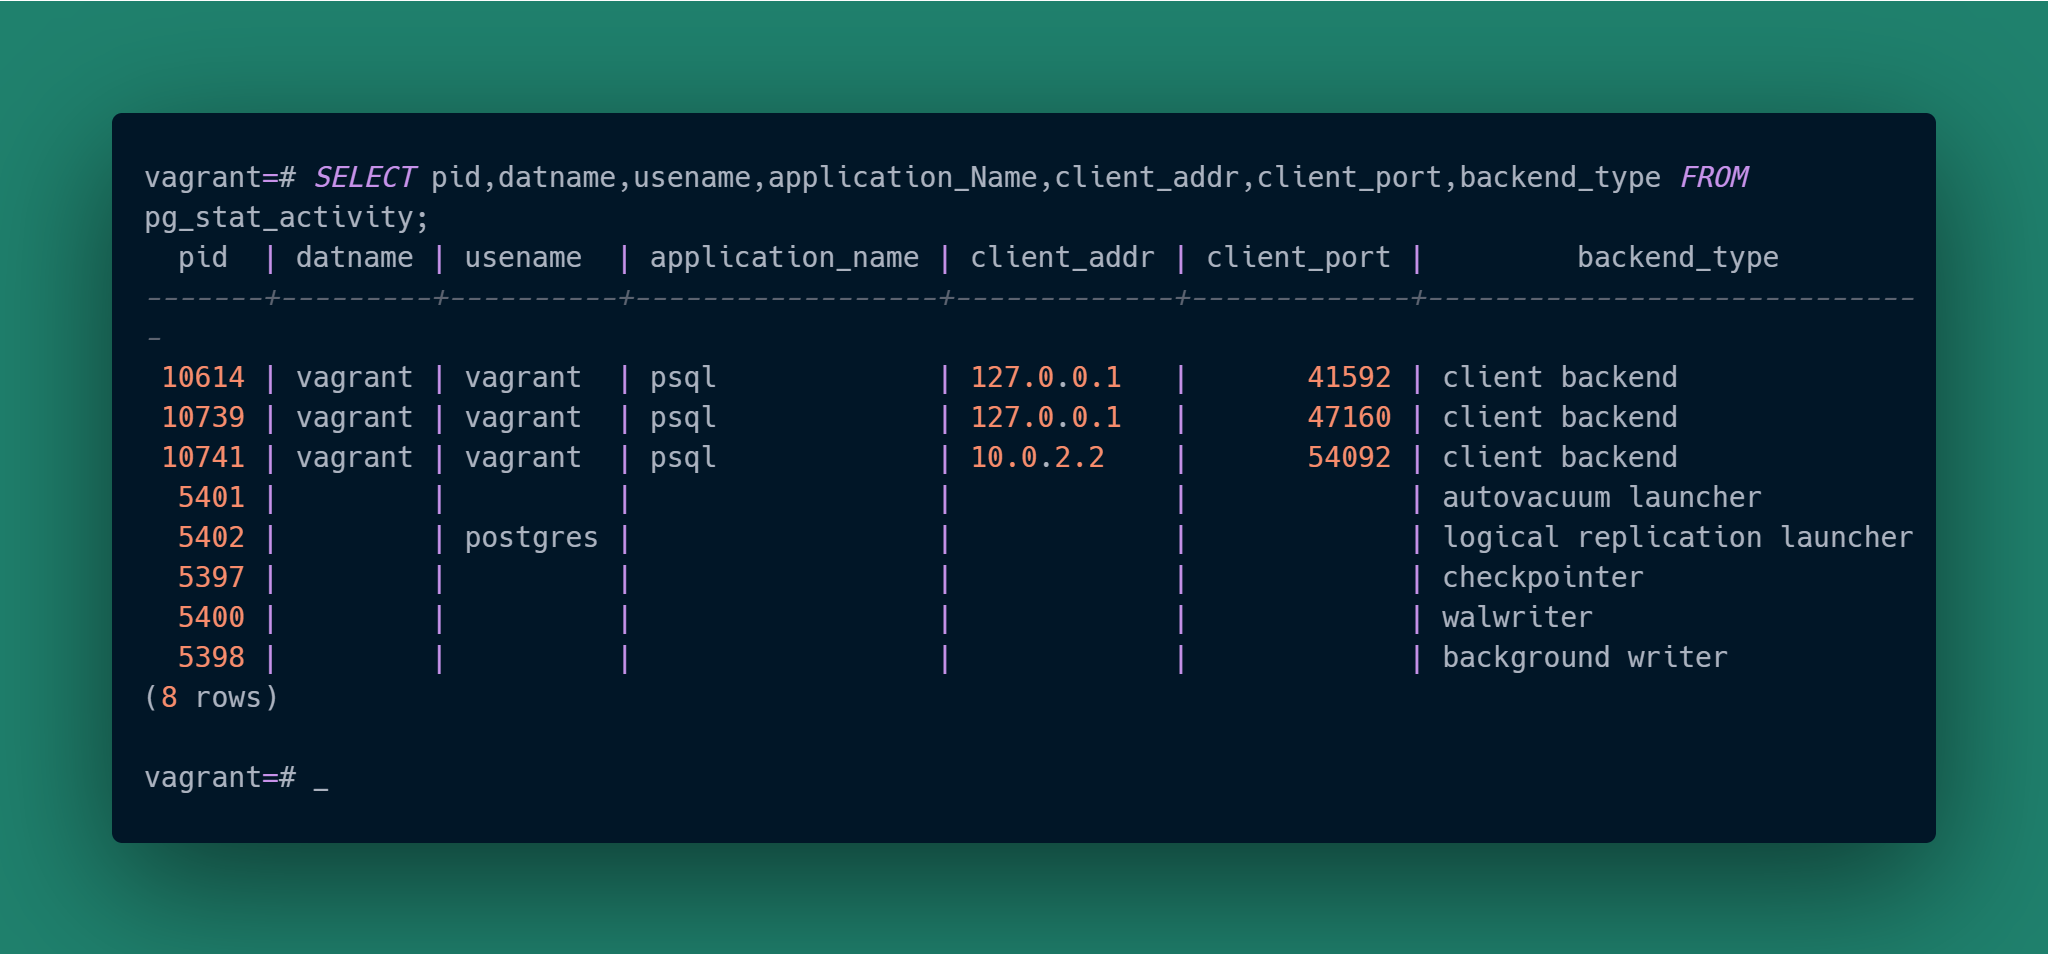
The ability to examine client connection activity is handled in PostgreSQL via the Cumulative Statistics System. Under-the-hood PostgreSQL uses internal tables to gather activity data which you then examine via pre-defined “system views”. We’re going to put one of them to work: pg_stat_activity.
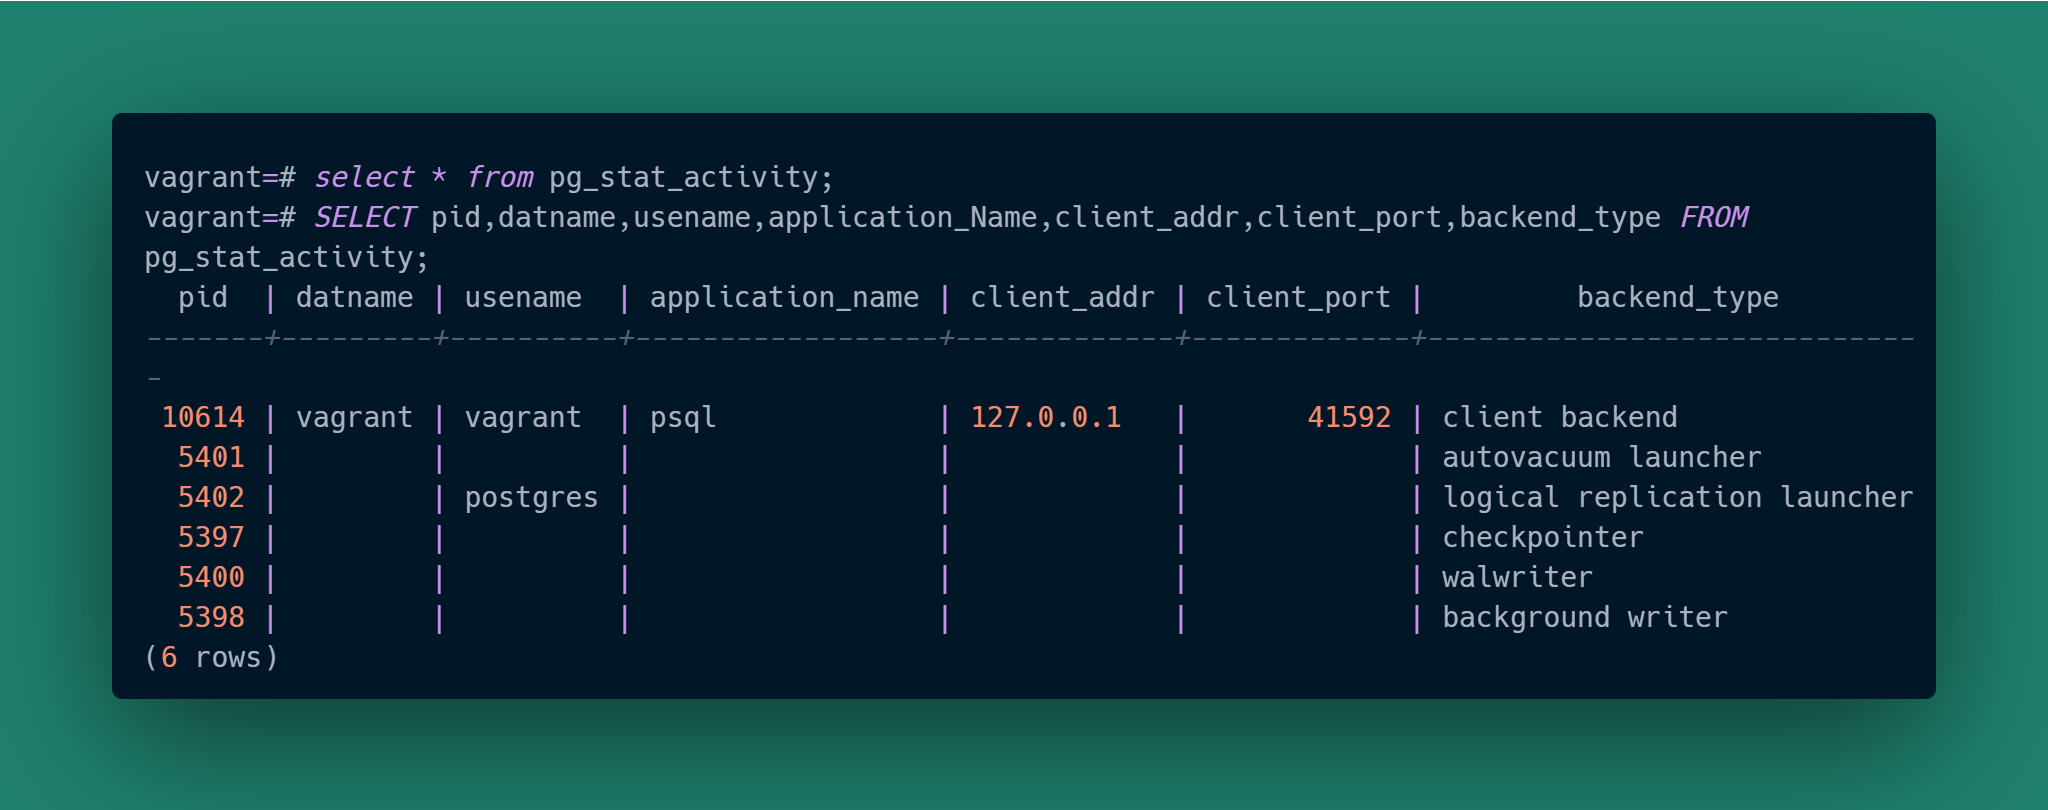
Our psql session is the only client we currently have connected (as shown by the backend_type being '“client backend”), and we can see it there in the response. As we are running on the same host as the database service and connected via “localhost”, our client IP address is correctly 127.0.0.1 as shown for client_addr. The client-side ephemeral port for the connection is 41592 as shown for client_port.
Notice the “pid” column. What is that 10614 process id for? Let’s look at the PostgreSQL processes just like we did in the previous article:
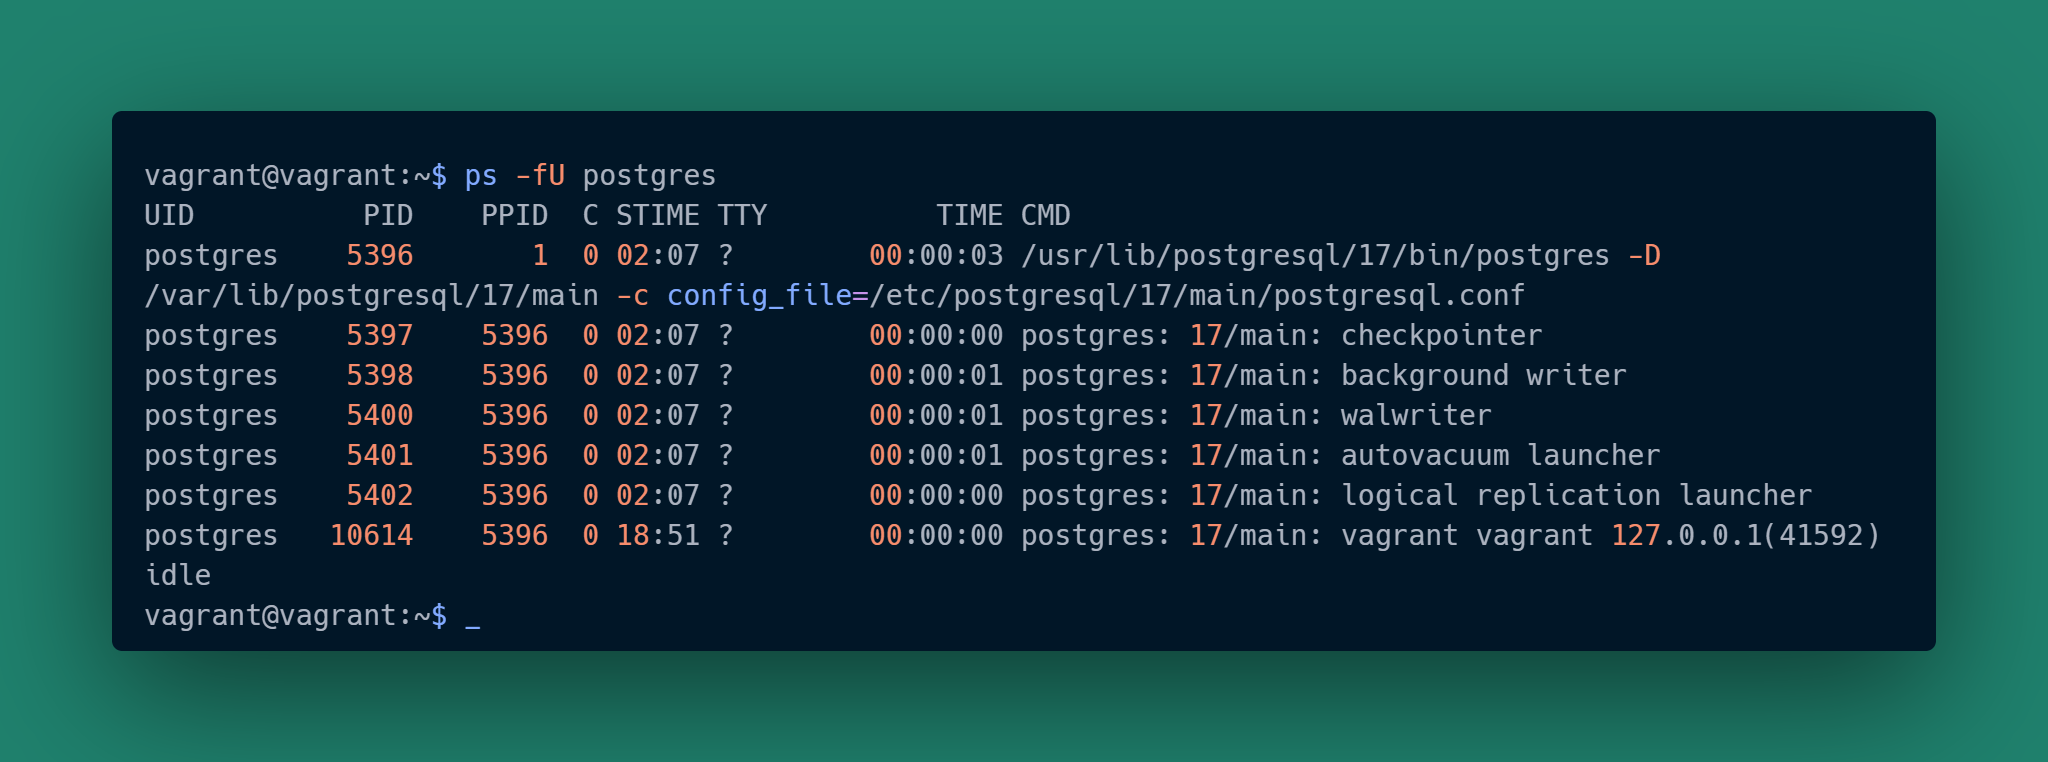
This has one more row than was shown in the previous article. That bottom row is the corresponding backend for our psql session. The “pid” shown in psql thus was for the backend process, not the client process. The ps output even shows the client IP address and ephemeral port that particular backend is handling.
Also compare the first entry of the ps results to our query response. That process doesn’t show in psql at all! That’s because it is the parent process with the Postmaster functionality. It doesn’t connect to the database, it is the thing that knows connections are something to be managed along with the processing resources assigned to them. As it doesn’t connect to directly perform database work, pg_stat_activity doesn’t know about it.
We only have that single psql session so it’s trivial to identify the client. We’re going to increase the difficulty by launching two more clients. One will be in another psql session on the same VM, and the other will be a psql session started from the underlying host that the VM is running on. As a reminder from the last article, we configured pg_hba.conf to allow connections via the mask 10.0.2.0/24 and here you are seeing why: the VM’s virtual network mapped the host to an address in that range.
Now we have three psql “client backend” sessions and no real way to tell between them. How do we figure out which client matches up with which backend? All we have are the backend process ids, but that tells us nothing about each client.
Remember earlier we noted that sockets are what associate processes with IP addresses and ports? That’s how we figure can this out. In the previous article one of the provisioning steps installed the iproute2 package, which provides us with ss.
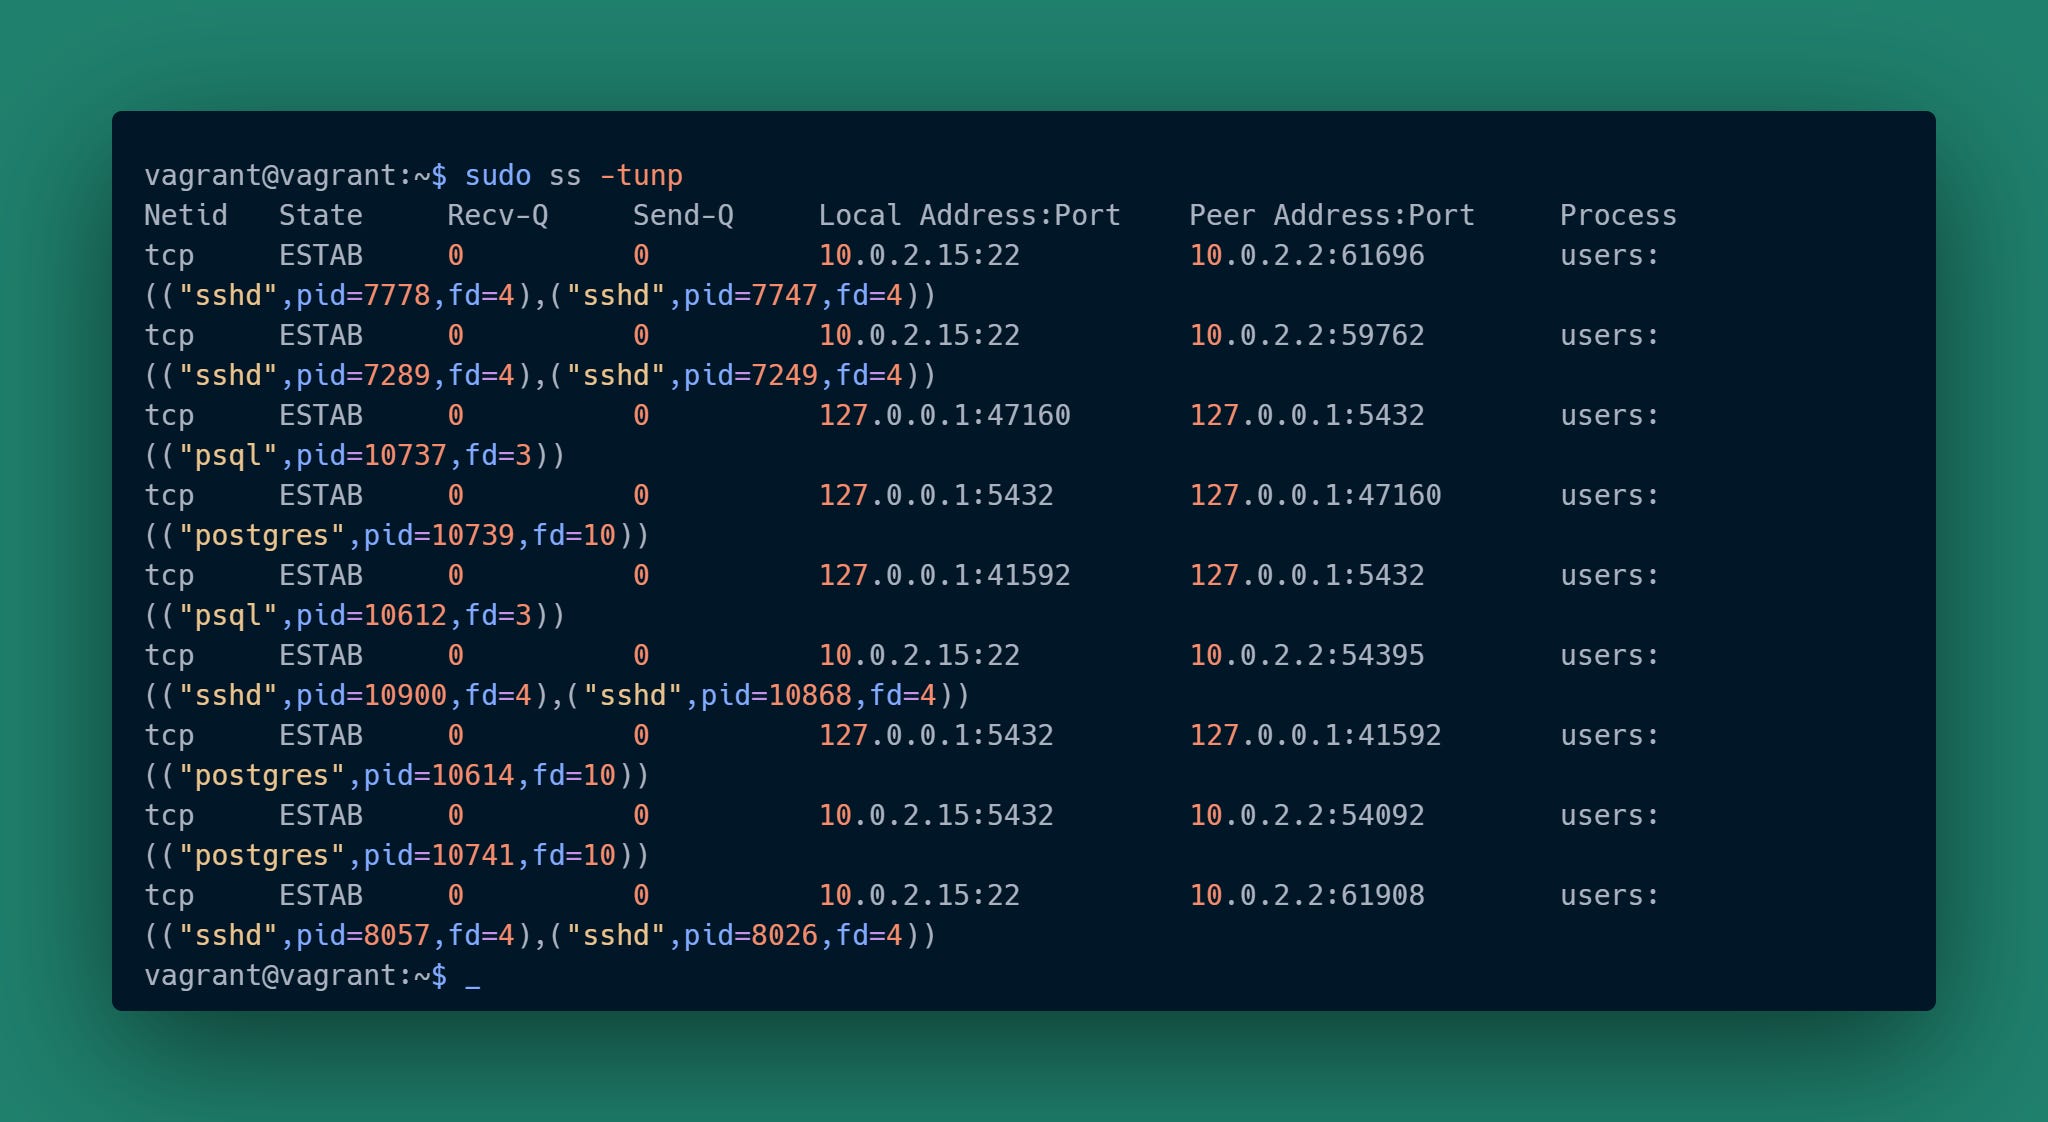
This shows us both the client and server connections that are on the VM.
You can ignore the “sshd” rows, those are for the terminal sessions I created.
sudo ss -tunp ensures we see the sockets and corresponding process data for all users.
ss -tunp (i.e. no use of sudo, running as vagrant); would have only shown “Process” column details for the client process sockets of the current user.
sudo -U postgres ss -tunp would have only shown “Process” column details for the backend process sockets. The backend processes run as the postgres user.
None of these shows the client details for the psql session launched from outside the VM. The only way to know client details is by doing this form of examination on the device corresponding to the client IP address.
The two entries with “psql” are the clients running on the VM. Each shows the “Local Address:Port” and corresponds to the “client_addr,client_port” columns shown earlier in the pg_stat_activity response. The PID showing is for the client process, not the backend.
The three entries with “postgres” are the backends running on the VM. Each has the PID that corresponds to the “pid” column shown earlier in the pg_stat_activity response. The “Peer Address:Port” corresponds to the client IP and port that backend will respond to.
As a quick aside, the “postgres” backend for the remote (host) psql client looks a little different than the other two cases. That psql client is not connecting via localhost, it is connecting via an IP address assigned by the VM’s virtual network. We can confirm that “10.0.2.15” is indeed the IP address assigned to the VM:
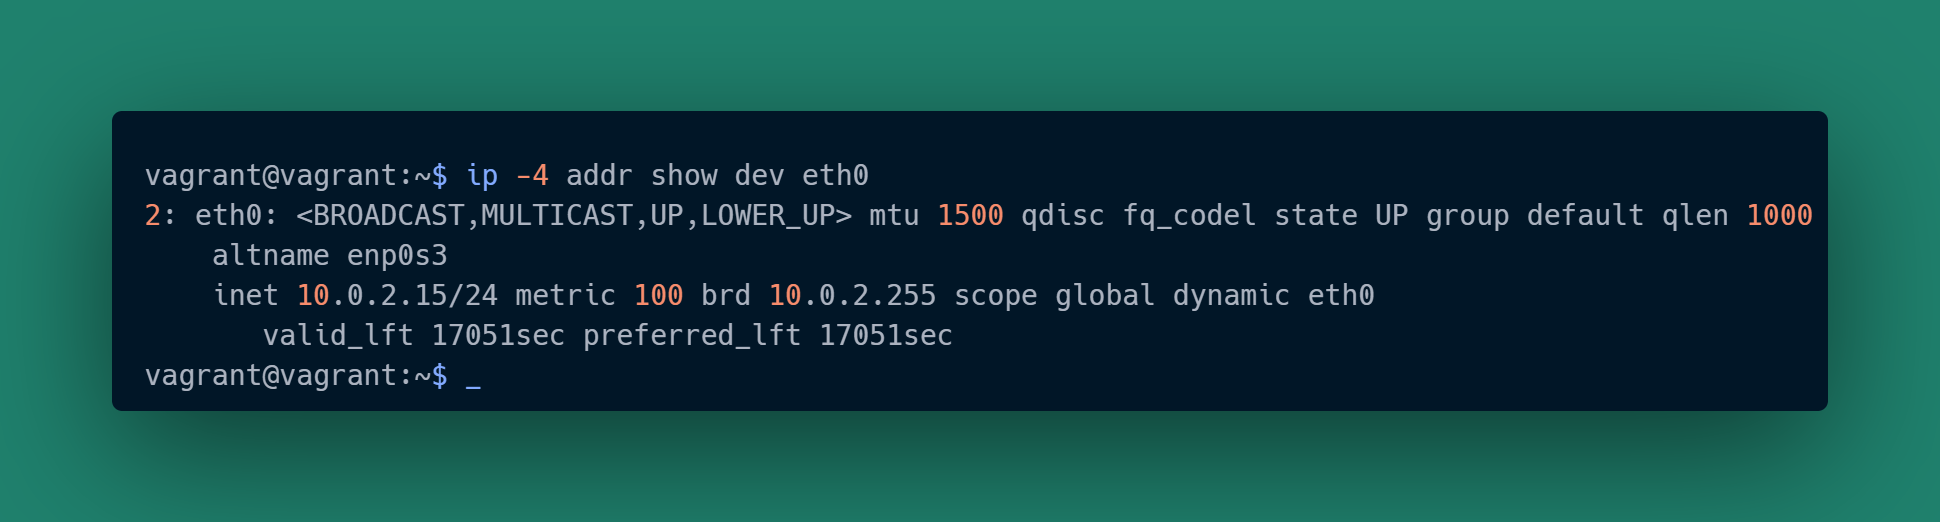
We are almost there.
Get the “Local Address:Port” on the “psql” rows.
Get the “Peer Address:Port” on the “postgres” rows.
Match them up. In database terms, do a join on (IP, Port) across both subsets.
Get the “pid” value from the “Process” columns. There will be two per match-up, one for the client and one for the backend.
|-------------|----------------|-----------------|------------|
| Backend PID |   Backend Addr |     Client Addr | Client PID |
|-------------|----------------|-----------------|------------|
|       10614 | 127.0.0.1:5432 | 127.0.0.1:41592 |      10612 |
|       10730 | 127.0.0.1:5432 | 127.0.0.1:47160 |      10737 |
|       10741 | 10.0.2.15:5432 |  10.0.2.2:54092 |          ? |
|-------------|----------------|-----------------|------------|
The final case is a little different because I’m running VirtualBox on Windows. For that we need to run netstat in a terminal window with privilege escalation:
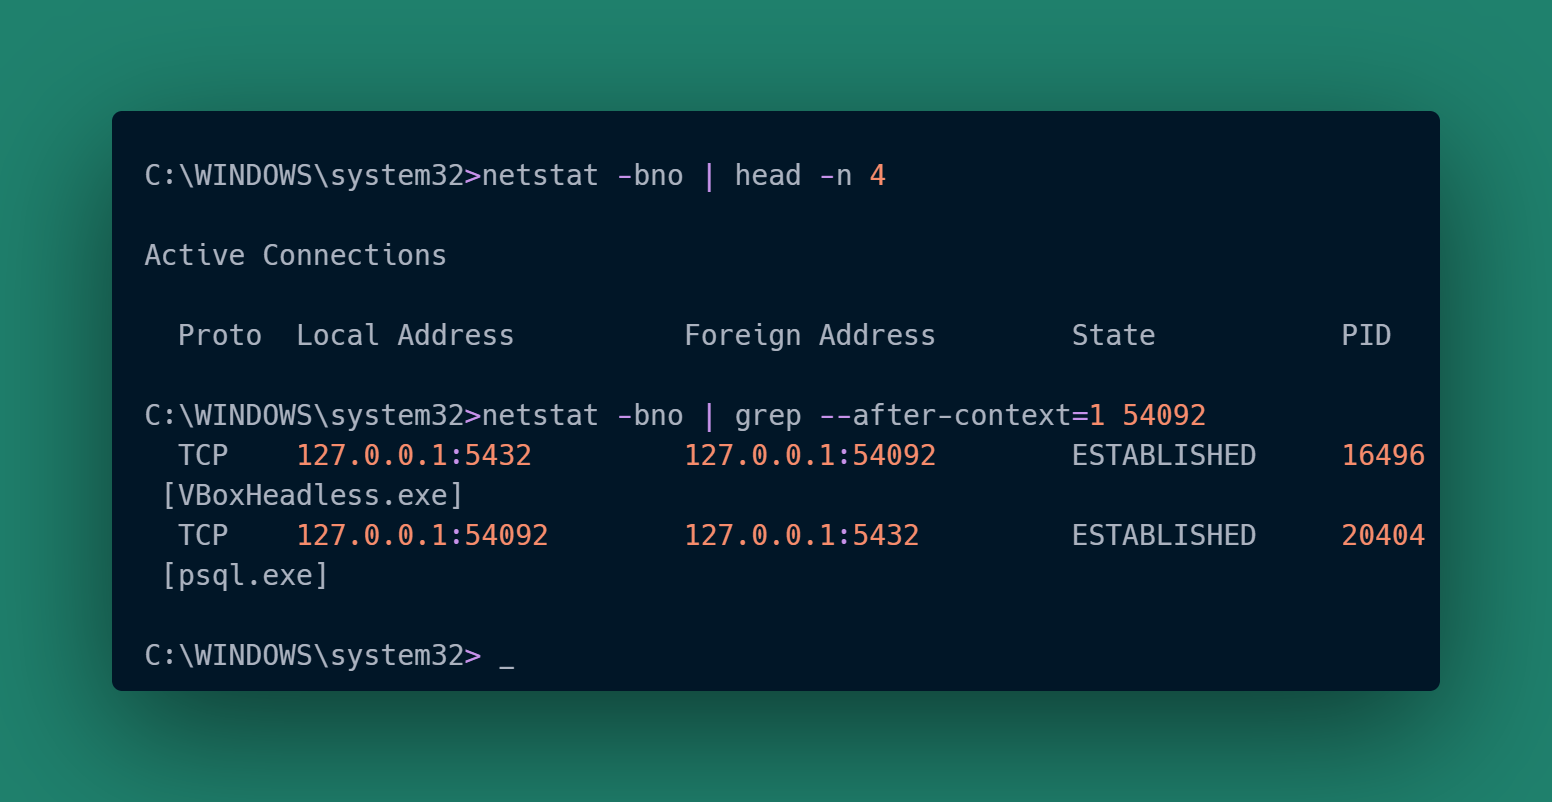
That gives us similar information for the third client, including how the backend connection is being proxied by VirtualBox. The PID for the proxy won’t correspond to anything within the VM and can be ignored.
We now have a client-process-to-backend-process correspondence! Completing the table required using either netstat or ss and having access to the appropriate client host, as identified by “client_addr” in pg_stat_activity. Discovering the client PIDs allows us to investigate those processes on those hosts. We weren’t even constrained to only searching on Linux.
Could you automate all this? Yes, assuming the client hosts are accessible to you. That’s a discussion for another day.
The Experimentalist : Client Connectivity with PostgreSQL © 2025 by Reid M. Pinchback is licensed under CC BY-SA 4.0