


Navigating career changes or the challenges of launching a new startup is hard if you don’t have a map for the forces pushing you back and form. Much of that map is established by the prevailing economic environment. Lately the world is abuzz with GenAI disruption, and while that is real, it isn’t the only time we’ve all experienced disruption. Some of the Sturm und Drang is distraction, and for the moment we’re going to set the distraction aside to look at the broader picture. In later articles we can dig into what is legitimately different now.
Diving into U.S. economic data can leave you wondering how any government could use it to intelligently steer a ship containing 340 million people, yet on the other hand also surprise you with effects that have clearly been playing out for a half century or more and thus should have been obvious to policy-makers. Put on your life vest, it’s going to be a bumpy ride.
Prev: Surfing Chaos | Next: Karl Marx Would Buy GPUs
Company Size and Asset Control
Since World War II the size of the largest companies has been increasing in the U.S. This is not merely a factor of population. It is also reflected in how assets are concentrated in the largest companies.
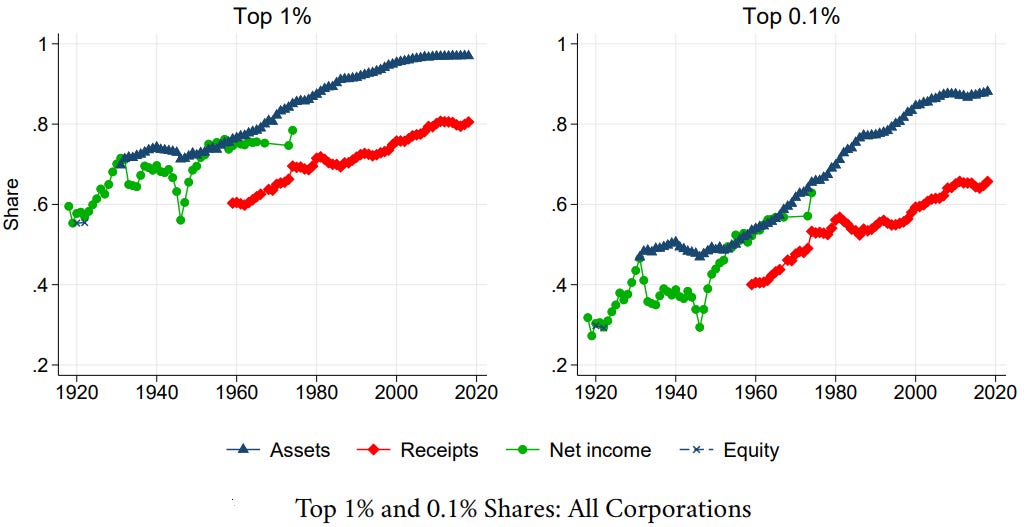
What the charts represent is simple. If you add up some financially-relevant measures across businesses after filtering out all the smallest firms like sole proprietorships, then the whatever those totals are, the percentage belonging to the top 1% or 1/10th of 1% largest companies is displayed. Which measures are shown depends on the historical data available, but we’re focusing on assets (the blue series at the top).
By 2020 the top 1% largest companies had about 97% share of all assets owned or controlled by all companies of non-trivial size.
By 2020 the top 0.1% largest had about a 86% share. That represents roughly the top 5000 largest corporations from about 1990 onwards, and fewer than 5000 in the years prior due to changes in the number of U.S. businesses over time.
If the financial heft of companies only grew due to population, then these shares would not be increasing, they would be flat if the number of competitors had not materially changed. This is a bigger-is-better effect that derives from economies of scale likely being a strong factor, plus some mix of tax policy and regulatory impacts that favor the larger survivors as competitors are bought out or fail to maintain market share.
The rapid increase in concentration from the 1960s onwards corresponds to a significant change in corporate taxation due to the Revenue Act of 1964. It wouldn’t have been the only factor, but that introduced a 6% difference in tax rates and arguably was the beginning of post-WWII corporate tax cuts that extend to the present day. Another relevant factor would be the U.S. going off the Gold standard in 1971, which led to an increase in the role of debt in growing the U.S. economy and made it easier for larger companies to buy peers or smaller firms.
As much as we hear the politics of lower interest rates, lower tax rates, and more available credit, history suggests that the bigger players have extracted more competitive leverage from those variables than smaller firms can manage.
Do companies control just financial assets, or do they also employ in similar proportion? The reason for asking is that if bigger companies also are bigger employers then this would suggest that bigger might be better for the workforce as well.
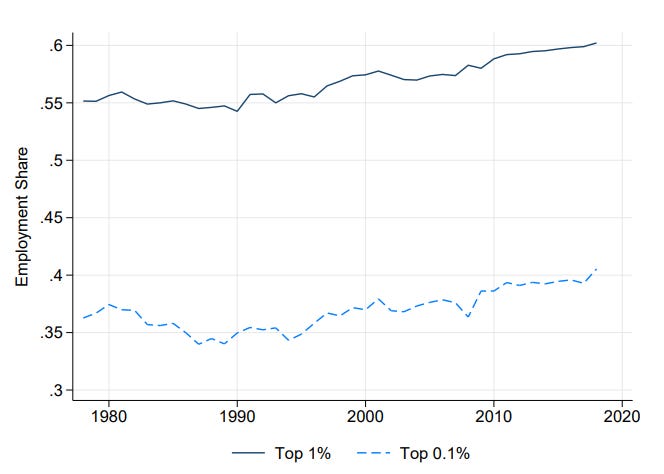
Unfortunately we’re only seeing data from 1980 onwards so commenting on long-term trend is probably not warranted, but the percentage shares do matter. The top 0.1% of companies that control 86% share of assets only employ a 41% share of the workforce; the top 1% with a 97% share of assets employ a 60% share of the workforce. That means the mere fact of businesses getting more concentrated has not generated direct employment in equal scale with their size. They’ll employ more people, but not 1-for-1 with net increases in financial concentration. Smaller companies are the ones picking up the slack in employment.
Why do we care? Because this shows that, at least within the U.S., the large corporations have successfully been eating everything except the available workforce. That makes them competition tough to fight head-to-head financially, yet possibly the opportunity that can be exploited if you start a business because, bluntly, eating the rich has greater reward given that they have more meat on the bone. For job-hunters, smaller firms could be the more probable source of employment since larger firms are more structured for increasing their financial gains per person, less so on increasing gains by increasing their workforce.
This also begs the question: why do states chase the biggest companies with large tax breaks? Without accounting very clearly for the specific type of business activity that will be gained by a deal, and how local supply chains will be benefit, encouraging smaller companies instead looks like a more effective employment strategy.
Smaller Companies Have to Fight Harder
You’ve probably heard that small business is the engine of job creation in the U.S. There is truth to it, as the chart above on employment share suggests. Unfortunately.
I say “unfortunately” for two reasons:
Smaller companies have to fight ever-harder to survive. Various studies have examined this, and the TL;DR is that the longer a small company survives the more likely it is to continue to be a survivor, but the initial years see a lot of wreckage. Perhaps not surprisingly, as the bigger companies gain more share of economic assets, the smaller firms lose share.
If the largest 1% of companies control 97% of assets, then that means the bottom 97% of companies only control 3% of financial assets. That’s not a lot of financial support to work with in order to be a supposed “engine.” That’s a weed whacker.
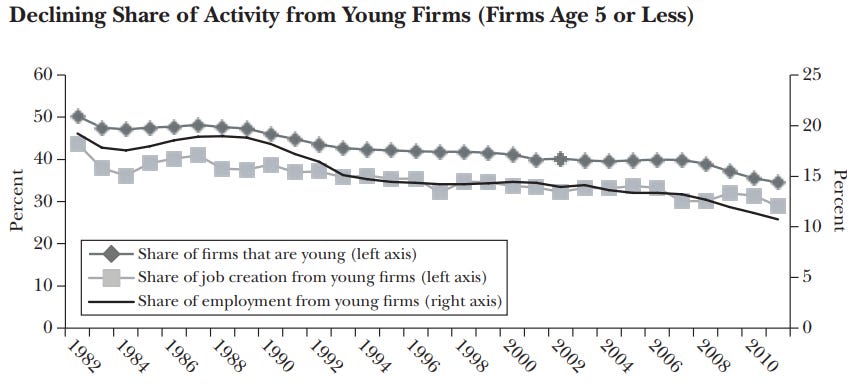
I don’t have data to extend the figure to earlier time periods, but from other data on new company creation per decade I strongly suspect the figure above would show this decline began at least 1 or 2 decades earlier, probably once the wave of activity from the post-WWII GI Bill had finished fully washing through the economic system.
What this likely shows is either a reduction in people taking on the risk of starting new businesses that need to hire employees, or more rapid buyouts, or an acceleration in failure rates in the early years. Most likely it is a combination of the three.
Small new entrants are experiencing an increasingly tough game. The survival statistics on small companies are brutal, so while small companies may be “the engine,” the employees in them are experiencing the turnover face-first with firms entering (being created) and exiting (failed or bought out). These small firms either have to go for broke in the mad scramble to be big enough to win the race on the survival statistics, or take a buyout and call it a day, or they have to find a niche and somehow entirely avoid all of this. The latter is something I intend to get into in other articles as the GenAI world may change some thinking in this space, but for now understand that collectively these figures hint at why you see so much venture capital pressure on small startups. From a VC standpoint, it is literally “go big or go home.”
Declining Job Growth
There is another factor that it is important to see, and this is one that may end up telling the future story of U.S. economic positioning within the broader global macroeconomic landscape.
This figure will take a little bit of explaining.
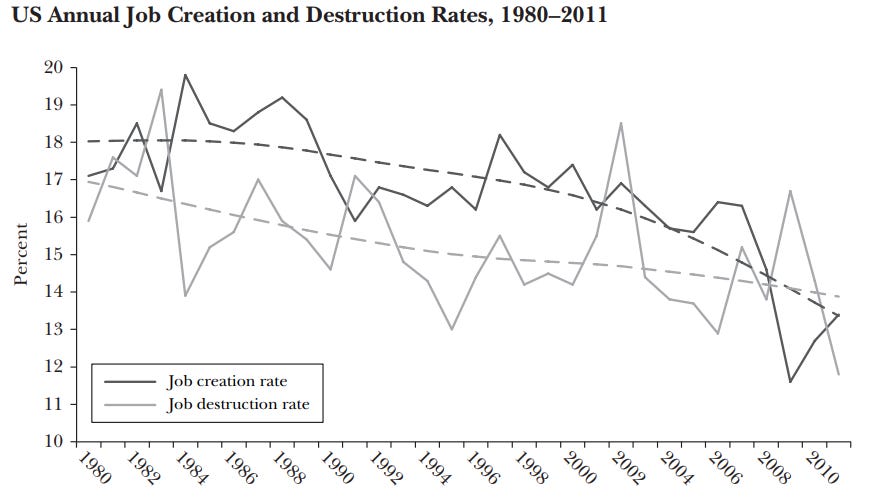
The darker jagged series is how many new jobs were created in that year. These would be companies expanding employment plus new companies appearing. Since these are annual numbers, there should be no seasonal adjustment.
The lighter jagged series is how many jobs were lost. Either companies were reducing employment or companies were failing. Again, these should not be seasonally adjusted.
The difference between the darker and lighter series is now many net jobs were added to the economy if that number is positive; if it is negative (the lighter series was above the darker) then that is how many net jobs were lost.
The darker and lighter dashed lines are smoothed versions of the noisier data.
When the economy is expanding then the darker and lighter dashed lines move further apart positively. When the economy is contracting they move closer together or negatively.
The downward trend on both means that, on average, the rate of net job creation is declining. How much that matters depends on whether population growth rate is also declining — which it mostly is, slightly (Source: The Brookings Institution) — but the slope shown here is a bit stronger than that and so likely reflects changes in the unemployment and the participation rates.
I examined the Bureau of Labor statistics for the years since 2011. You get expected distortion around economic events like COVID that trigger liquidity injection, but mostly the story of a declining rate of net job growth holds true.
At a minimum this highlights one reason why political discourse can be fraught. The expansionary phases in this situation are a relatively modest and temporary effect compared to the overall trend. It is entirely possible that at some point not too far off the prevailing economic philosophy in the U.S. will have to set aside an assumption of endless growth by large companies. Either smaller companies will have to increase in representation within the economy, or the U.S. will have to shift to a degrowth economic model and possibly manage policy to encourage population decline.
The Small-Cap Upside
There actually is a slight upside in spite of the picture painted above. Small companies have at least one advantage over many larger companies, thus the idea of smaller players returning to economic prominence isn't entirely outlandish.
On average, small companies are more profitable: U.S. large caps returned 6.6% while U.S. small caps returned 9.2% annually over a 20-year period (Source: Alpha Architect). The spread between them used to be larger, but the reason for large-cap profitability gains largely goes back to earlier points about advantages of scale and tax treatment. So long as some advantage remains, U.S. small companies should remain a focus of VC funding.
A reasonable question which I won’t get into here is how much of that large-cap profitability improvement is due to organic factors such as actually creating new products and services, versus financially-engineered improvements like M&A and stock buybacks that show up mostly in accounting statements. Making numbers better of course matters to investors, but it isn’t the same kind of lasting value creation you get from building new things you could actually poke with a stick, and usually lacks the same long-term growth potential.
If interest rates and inflation remain elevated, both of which have some fundamental reasons for being the case, then those forces may favor companies with real organic growth over those that only appear to grow via financial engineering. Financial engineering may not grow value faster than inflation because you have to keep discovering more and more accounting tricks to extract value out of an otherwise fixed situation. Like, for example, the recent wave of layoffs blamed on AI.
Fit the Puzzle Pieces Together
Pause to see how the components of the system are fitting together.
A significant share of employment comes from smaller companies, not just the largest 1%.
Small companies drive net job gains in the economy.
The largest 1% are eating all the financial assets.
Share of job creation activity in young firms is declining.
The rate of net job creation in the economy is declining.
This is why in the opening I said “… effects that have clearly been playing out for a half century or more and thus should have been obvious to policy-makers.” Making policy that cozies up to the largest firms is not effective economic management. It is, if anything, almost the exact opposite of what is needed because it mostly maintains the status quo instead of improving upon it. Small and mid-sized firms are the need, and possibly the opportunity because — let’s be real about the implications here — the biggest firms are running out of financial activity share to eat. Whatever the largest eat will turn into something less profitable, with lower growth, and lower employment. It’s time for the small fish to remember that piranhas can eat things too.
The potential for organic growth in smaller ventures is an area of likely advantage for GenAI builder-folk that I want to dig into with future articles.
References
The Experimentalist : Economic Currents © 2025 by Reid M. Pinchback is licensed under CC BY-SA 4.0